Source: World Bank: 2001 World Development Indicators
 April
1, 2002 Late last month, rich nations pledged more aid to poor
nations
at the International Conference on Financing for Development held in
Monterrey,
Mexico. After years of declining foreign aid, the United States
and
the European Union rekindled the commitment of wealthy nations to
alleviate
extreme poverty in the world. President George Bush pledged an
additional
$5 billion in U.S. official development assistance over the next three
fiscal years, and the European Union countries promised to gradually
increase
their donations over the next several years. "Rich countries and
poor have struck a new bargain to fight poverty," said Mexican
President
Vicente Fox on the last day of the Monterrey summit. "We can
speak
of a new commitment between countries in the vanguard and countries
bringing
up the rear," Fox reiterated.
April
1, 2002 Late last month, rich nations pledged more aid to poor
nations
at the International Conference on Financing for Development held in
Monterrey,
Mexico. After years of declining foreign aid, the United States
and
the European Union rekindled the commitment of wealthy nations to
alleviate
extreme poverty in the world. President George Bush pledged an
additional
$5 billion in U.S. official development assistance over the next three
fiscal years, and the European Union countries promised to gradually
increase
their donations over the next several years. "Rich countries and
poor have struck a new bargain to fight poverty," said Mexican
President
Vicente Fox on the last day of the Monterrey summit. "We can
speak
of a new commitment between countries in the vanguard and countries
bringing
up the rear," Fox reiterated.
There is a huge gap in income and wealth distribution between the "haves" and "have nots" in the world, and there are indications that this gap is widening. A recent study by senior World Bank economist, Branko Milanovic, published in the Economic Journal in January shows an alarming increase in global inequality in the last decade. Mr. Milanovic found that the richest 1% of the world currently have income equivalent to the poorest 57%, 80% of the world's population live below what countries in North America and Europe consider the poverty line, and the poorest 10% of Americans are better off than two-thirds of the world population.
Prior to the Monterrey summit, President Bush addressed the issue of global inequality and poverty at a meeting of the Inter-American Development Bank on March 14 in New York: "I'm here today to announce a major new commitment by the United States to bring hope and opportunity to the world's poorest people," said Bush in his opening remarks. Noting that the advances of free markets and democracy and rule of law have brought prosperity to an ever-widening circle of people in this world, President Bush went on to say, "Yet in many nations, in many regions, poverty is broad and seemingly inescapable, leaving a dark shadow -- a dark shadow -- across a world that is increasingly illuminated by opportunity. Half the world's people still live on less than $2 a day. For billions, especially in Africa and the Islamic world, poverty is spreading, and per capita income is falling. This growing divide between wealth and poverty, between opportunity and misery, is both a challenge to our compassion and a source of instability. We must confront it. We must include every African, every Asian, every Latin American, every Muslim, in an expanding circle of development."
Global Inequality
According to the World Bank, low income countries represented 40 per
cent of the world's population but only 11 per cent of the world's
gross
national income in 1999. In sharp contrast, high income countries
represented only 15 per cent of the world's population and 56 per cent
of the world's gross national income. Data from the World Bank's
2001
World Development Indicators are presented in the table below.
|
Ranking |
(millions) |
of Population |
($ billions) |
of GNI* |
| Low Income |
|
|
|
|
| Lower Middle |
|
|
|
|
| Upper Middle |
|
|
|
|
| High Income |
|
|
|
|
|
|
|
|
|
|
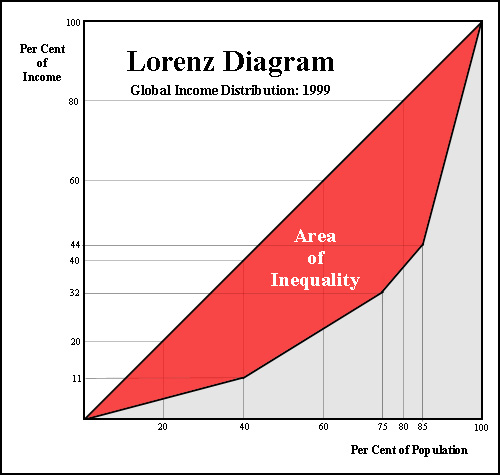
The figures from the table above are presented below in a form of the Lorenz diagram, a device for depicting the distribution of income among groups. It has become an icon of income inequality and distribution analysis. The cumulated per cent of the population is shown on the horizontal axis; the cumulated per cent of income is shown on the vertical axis. If income were distributed perfectly equally, then the first 20% of the the population would account for 20% of the income, etc. Thus, the diagonal line represents perfectly equal income distribution. When actual incomes are distributed unequally, as depicted in the diagram below, the Lorenz curve is bowed further away from the diagonal line. The red shaded area represents the degree of inequality for global income distribution in 1999 according to the World Bank statistics.
Source: World Bank: 2001 World Development Indicators
The Gini coefficient of inequality expresses the red shaded area as a per cent of the total area beneath the diagonal line. That is, the Gini coefficient is the red shaded area divided by the red and gray areas in the diagram. The Gini coefficient scales from 0 to 100. The closer to zero, the more equal is the distribution. If income distribution were perfectly equal, then there would be no red shaded area and the Gini coefficient would be zero. The closer to 100, the more unequal is the distribution. The Gini coefficient for the diagram above is approximately 55, indicating a relatively significant degree of inequality in global income distribution in 1999.
The crude method used here to calculate the Gini coefficient fails
to
take into account the degree of inequality in distribution within
countries. In other words, it reflects the unequal distribution
of
income among countries but misleadingly assumes that income is equally
distributed within the countries themselves. If there is unequal
distribution of income within countries, then the Gini coefficient
among
families in the world would be higher. Therefore, the estimate of
55 undoubtedly understates the actual degree of global inequality,
because
many countries have extremely unequal internal distributions of
income.
For example, the table below shows Gini coefficient estimates for 10
selected
countries.
|
|
|
|
|
|
|
|
|
|
|
|
|
|
|
|
|
|
|
|
|
|
|
|
|
|
|
|
|
|
|
|
|
|
|
|
|
|
|
|
|
|
|
The study published by Branko Milanovic referenced above takes into account that income is distributed unequally within nations as well as among them. His inequality among people in the world is calculated as if we all belonged to a single world nation. Thus, his work has gone deeper than past studies by combining the disparity in income distribution among nations with the inequality found within them. Looking at 91 countries, covering 85% of the world's population and 95% of world income, Milanovic estimates the global income distribution Gini coefficient to be 66. This level of inequality is equivalent to a situation where 66% of people have zero income, and 34% divide the entire income of the world among themselves equally!
Income Distribution Vs. Redistribution
Lorenz diagrams and Gini coefficients fall within the realm of positive economics. That is, they merely state the facts without incorporating value judgments. The branch of economics that deals with value judgments is called normative economics. To say that global income is distributed unequally is a positive economic statement. Empirical estimates of Gini coefficients, for example, are positive calculations. On the other hand, to say that unequal distribution is undesirable is normative. To assert that global income should be distributed more equally among and/or within nations assumes a moral position. Positive economic statements are either true or false. The validity of a positive statement can be proven by scientific method and appeal to the facts. Normative economic statements are neither true nor false. There is no appeal to the facts in normative economics; there are only arguments. The arguments generally appeal to our senses of goodness and fairness and rightness.
Pure egalitarianism, for example, holds that a more equal distribution of income and wealth is preferred to a more unequal one. That is an argument, not a fact. If income is distributed unequally, then egalitarians advocate the redistribution of income from the rich to the poor. There is something inherently simple about equality. It is easy to understand the concept of each person getting an equal share. When distribution is unequal, it becomes more difficult to explain. Gini coefficients of inequality do not address causality, and a global income Gini coefficient of 66 begs for an explanation. The most plausible explanation is the market economy. It distributes income according to productivity values that are determined within the context of supply and demand. Rich people and nations are rich, simply because they supply things that are scarce relative to high demand. Poor people and nations are poor, simply because they supply too many things for which there is relatively little demand. Critics of the market economy are proponents of income redistribution through taxes and transfers to make the final distribution more equal.
We see this phenomenon in households that reside within the market economies. Consider a household of four persons. The primary bread-winner earns $60,000 per year. The other spouse earns $30,000. One of the children works part-time while attending college and earns $10,000. The other child is too young to work, attends school, and earns nothing. The total income of the family is $100,000. At first blush, it would appear that income within this household is distributed according to productivity and very unequally. The Gini coefficient of inequality would be very high, approaching 100. Few would advocate that the family divide the family income equally and give each member of the family $25,000 to spend on whatever they want. After all, the children would probably foolishly spend their equal share on Nintendo games and music CDs. However, after we take into account the transfers of income from the parents to the children in terms of room and board, education, and other allowances, we find that the effective distribution of household income is much more equal and the Gini coefficient moves closer to zero. Parents assume a moral responsibility for the welfare of their children; and one is reminded of Adam Smith's assertion in his book, The Wealth of Nations: "What is prudent in the conduct of every private family can scarce be folly for that of a great kingdom."
Foreign Aid
The concept of foreign aid from rich nations to poor nations is partially based on the premise that a more equal income distribution would be better for the world. Foreign aid is also based on an assumed, albeit justified, moral imperative that the rich have some responsibility to alleviate, if not to eliminate, global poverty. Normatively, there is a stronger case to be made for alleviating poverty in the world than to merely redistribute the income and wealth to achieve greater equality. To the extent that foreign aid from rich nations to poor nations can foster economic growth and development, it seems justified. The problem is that there is virtually no empirical positive correlation between foreign aid and economic development. Critics of foreign aid are quick to point out that the United States has given more than $500 billion to less developed countries since 1945, but the people in many of these countries are no richer today than they were decades ago. Unfortunately, much of the foreign aid from rich countries to poor countries has fallen like thin drops of water on a hot rock. Internal corruption, restrictions on freedom, and impediments to trade have retarded economic development in those countries to a greater degree than aid has fostered it.
The poor performance of foreign aid in terms of fostering
development
probably explains why the rich countries donate such a small per cent
of
their total income to less developed countries. The table below
shows
Official Development Assistance (ODA) for 22 industrialized countries
in
2000. Note that the United States is the world's 2nd largest aid
donor (behind Japan) in terms of total dollars, but last among the 22
countries
where ODA is expressed as a per cent of each country's Gross National
Product
(GNP). The United Nation's official development assistance target
is 0.7 per cent of GNP. Most nations do not meet that target.
|
|
(millions) |
of GNP |
|
|
|
|
|
|
|
|
|
|
|
|
|
|
|
|
| Luxembourg |
|
|
|
|
|
|
|
|
|
|
|
|
|
|
|
|
|
|
|
|
|
|
|
|
|
|
|
|
|
|
|
|
|
|
|
|
|
|
|
|
|
|
|
|
|
|
|
|
|
|
|
|
|
|
|
|
|
|
|
|
|
|
|
|
|
|
|
|
|
Conclusion
At the foreign aid summit in Monterrey, rich nations pledged to proffer more aid to the world's less developed countries. World leaders have indicated that the significance of the summit was a consensus that wealthy nations have an obligation to provide more development aid, while poor nations are obliged to spend the money wisely. That means eliminating corruption, dismantling trade barriers, improving government efficiency and macroeconomic policies, and assuring that aid leads to measurable results in terms of economic development and poverty reduction. The next step will be to spell out a specific program required to achieve these goals at yet another summit opening in Johannesburg in August 2002.
Sources and Recommended Links
The International Conference on Financing for Development
Organization for Economic Cooperation
and Development (OECD)