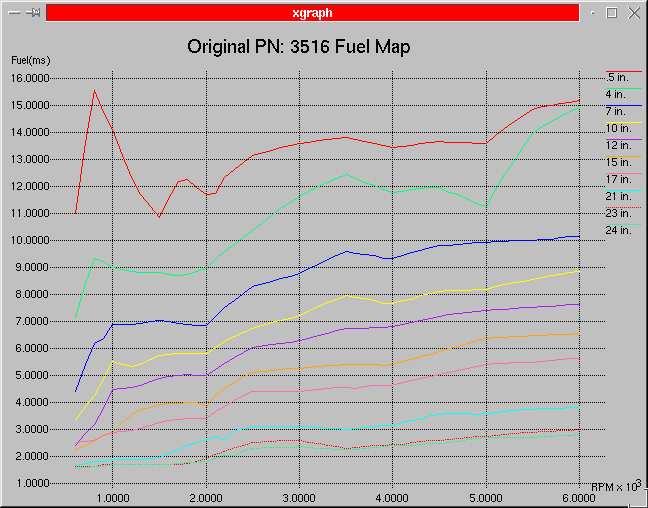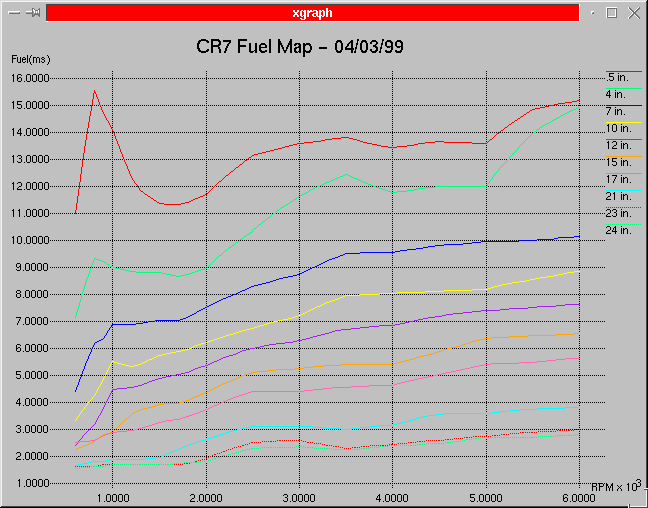
As time progressed and I logged more real time performance data from the ECU I saw that generally the fuel map was being pulled to the rich side. One of the biggest reasons for this is the ECU's poor performance in handling the MAT (air temperature) data. Still working on this one. Another area that I noticed something odd was that I had always had to make the mixture richer around the 2000 RPM region for most MAP settings. Looking at the original fuel map for the #3516 code all of the curves had a suck out right around 2000 RPM. Right smack in the middle of where I had always needed to add more fuel to get acceptable performance and smoothness. What I have done is to adjust the original fuel maps up in this region and bring all the user modifiers back to zero. I don't know why the original map had some of the sharp edges and the leaning around 2000 RPM that it did, but the new modified map is working out well for my engine combination.
The below table is the modifiers that I had to apply to the original Fuel Map.......

The plot below shows the original PN: 3516 Fuel Map........

And this last plot is what I am running today........

By the ways these curves were derived with these conditions: 