XINViewer Documentation
Razvan Surdulescu,
Eva-Maria Strauch (c) 2004
Table of Contents
- Introduction
- Displaying and
Exploring a Protein-Protein Interaction Network
- Selecting Network Nodes
- Panning and Zooming
the Network
- Searching a
Protein-Protein Interaction Network
- Cliques and
Hubs In a Protein-Protein Interaction Network
- Finding Cliques and Hubs
- Extracting Cliques and
Hubs
- Network Statistics
- Known Issues
1. Introduction
XINViewer is a DIP XIN
Protein-Protein Interaction Network viewer written in Java. It was written entirely from
scratch as a final project for CH391L.
This document describes how to use XINViewer.
2. Displaying and
Exploring a Protein-Protein Interaction Network
When you launch XINViewer, you will be presented with the main
product window:
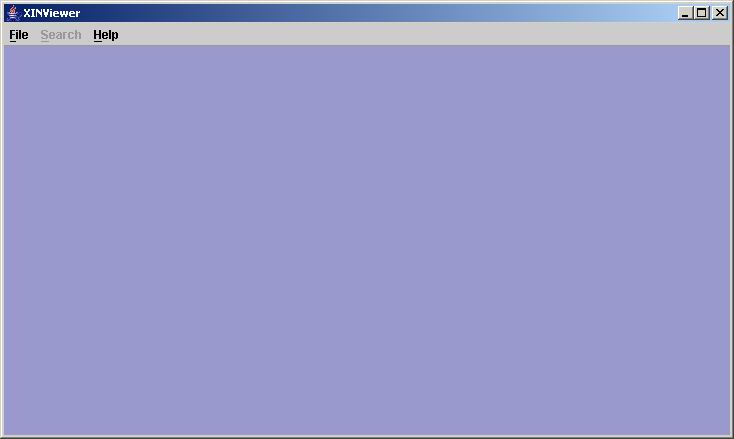
On this window, you can load and display a XIN file containing a DIP
protein-protein interaction network. Go to
the File menu, select Open,
and choose a XIN file (such as "Ecoli20041003.xin"):
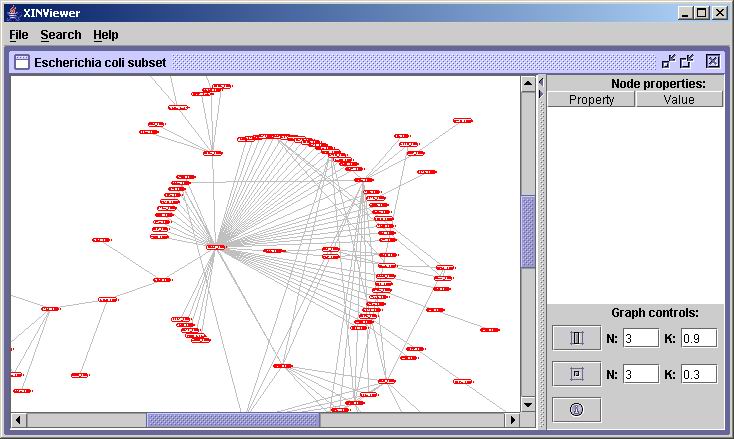
You can load as many XIN networks as you wish inside the main
XINViewer
window. Each network will have its own window and can be moved, closed
or hidden
independently.
Selecting Network Nodes
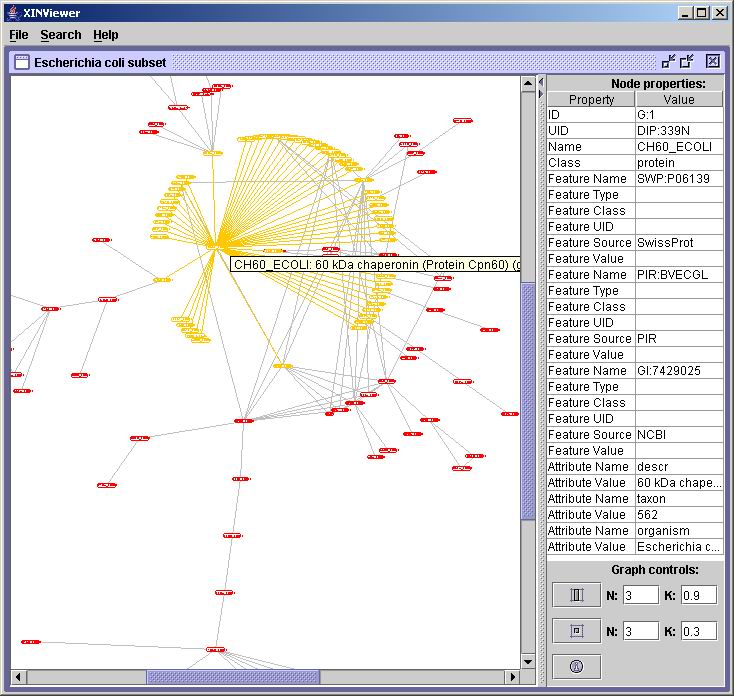
You can click on any node in the network to select it and see its
details displayed in the table on the right:
Notes:
- When you click on a network node, the network will be re-laid out
with the node you clicked on in the center and all its immediate
neighbors laid out radially around it. That node's properties will be
displayed in the table on the right.
- If you hold down the
ALT key when you click on a
network node, the network will not
be re-laid out. Only the node's properties will be displayed in the
table on the right.
- If you just hover the mouse over a network node, that node and
its immediate neighbors will be highlighted in orange, and you will see a
tooltip with that node's name and description.
Panning and Zooming
the Network
Clicking and dragging in the white area of the network window allows
you to pan and zoom the network:
- If you click with the left
mouse button and drag left-right or up-down, the network will pan.
- If you click with the right
mouse button and drag up-down, the network will zoom.
3. Searching a
Protein-Protein Interaction Network
You can search for any text string that describes a network node.
For example, if you want to search for "chaperonin" (a string that
describes the center node in the network), hit CTRL+F or
go to the Search
menu, and select Find:

The first node containing that string (if any) is highlighted in dark cyan on the screen:
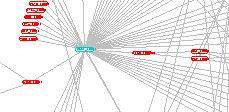
Note that the highlighted node might be off the visible area of the
screen, so you may have to pan and zoom the network to find it. In rare
cases, the highlighted node has many other nodes laid out on top of it,
so it does not appear at all; this is a known bug.
To find additional nodes that contain that same string, hit F3
or go to the Search
menu, and select Find Next.
If no additional such nodes exist, you will be prompted.
4. Cliques
and Hubs In a Protein-Protein Interaction Network
The central idea of this project is to allow the user to explore
salient features of a protein-protein interaction network via cliques
and hubs. Briefly, a clique (in our definition) is an almost fully-connected set of
neighboring nodes; a hub (in our definition) is a set of neighboring
nodes where one node has connections to all other nodes, while the
other nodes have few connections between them (imagine a
hub-and-spoke).
We believe that cliques and hubs in protein-protein interaction
networks represent important biological processes that warrant special
attention.
Finding Cliques and Hubs
You can find cliques and hubs via the controls in the bottom-right
side of the window:
- Clique controls:

- Hub controls:

The two text boxes in each set of controls control the clique and hub
search parameters:
- N represents the minimum
number of nodes that must participate in a clique or hub to be found.
In other words, no clique or hub of less
than N nodes will be found.
- K represents the clustering coefficient that must be met by a set
of nodes to be called a clique or hub.
- The clustering coefficient is defined as the ratio of the
number of actual connections
between nodes to the number of theoretical
connections between nodes.
- For example, given a set of 5 nodes, there are 10 possible
theoretical connections between them
- If these nodes form a clique, then the number of actual
connections will be close to 10, so the clustering coefficient will be
high (upper bounded by 1)
- If these nodes form a hub, then the number of actual
connections will be close to 5, so the clustering coefficient will tend
to be low (upper bounded by 0.5)
- For a clique, K is the minimum
clustering coefficient (only sets of nodes that have a clustering
coefficient higher than K
will be called cliques).
- For a hub, K is the maximum
clustering coefficient (only sets of nodes that have a clustering
coefficient lower than K will
be called hubs).
- You can change N or K by typing another number in the respective
text box.
- Note: you must hit Enter,
otherwise the value
will not be committed into the text box! This is a known bug.
- When you wish to search for a clique or a hub, you can click the
button in the left of these controls.
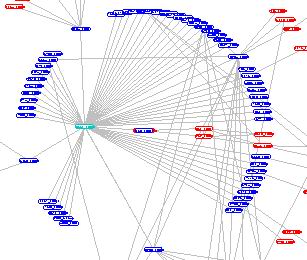
- If a clique or a hub is found, it is highlighted (cliques are
shown in green, hubs in blue). See samples below:
- Just like with searching for text in nodes, the highlighted
nodes might be off the visible area of the screen, so
you may have to pan and zoom the network to find them.
- In rare cases, the
highlighted nodes has many other nodes laid out on top of it, so they
do
not appear at all; this is a known bug.
A sample clique:

A sample hub:
Extracting Cliques and
Hubs
Once you have found a clique or a hub, you can extract it into its own
separate window to better see it and explore its nodes. To do this
right-click on any node highlighted as part of a clique or a hub, and
select "Extract Network" from the pop-up menu. Here is a sample
extraction of a hub (highlighted in blue in the background):
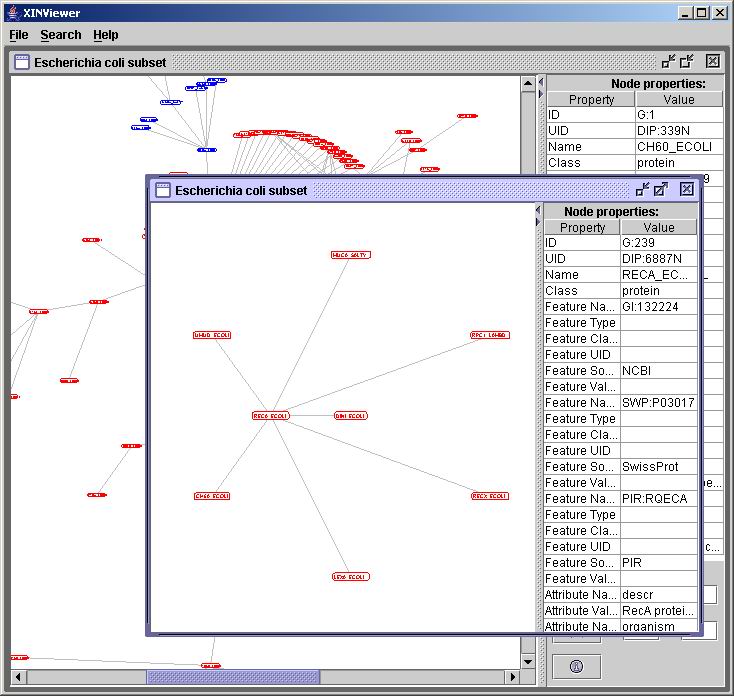
The new (extracted) window behaves exactly the same as the original
protein-protein network window.
5. Network Statistics
You can get a set of high-level statistics about the
protein-protein
network by clicking on the statistics button in the bottom-right side
of the window: 
This displays a window containing the following kind of textual
information:
Graph statistics:


Number of nodes: 466

Number of edges: 611

Maximum diameter: 19

Average diameter: 4


Clustering coefficients histogram:

Bin #0: [0 - 0.1] 131.0

Bin #1: [0.1 - 0.2] 0.0

Bin #2: [0.2 - 0.3] 4.0

Bin #3: [0.3 - 0.4] 0.0

Bin #4: [0.4 - 0.5] 7.0

Bin #5: [0.5 - 0.6] 19.0

Bin #6: [0.6 - 0.7] 56.0

Bin #7: [0.7 - 0.8] 5.0

Bin #8: [0.8 - 0.9] 9.0

Bin #9: [0.9 - 1] 2.0

Bin #10: [1 - 1.1] 233.0

Overflow: 0

Underflow: 0

Average: 0.6391008570193119

Standard deviation: 0.42872359584364245

Kurtosis: -1.350054769408164

Skewness: -0.6412215419297523


Average distances histogram:

Bin #0: [0 - 1] 0.0

Bin #1: [1 - 2] 160.0

Bin #2: [2 - 3] 27.0

Bin #3: [3 - 4] 9.0

Bin #4: [4 - 5] 66.0

Bin #5: [5 - 6] 23.0

Bin #6: [6 - 7] 15.0

Bin #7: [7 - 8] 13.0

Bin #8: [8 - 9] 7.0

Bin #9: [9 - 10] 10.0

Bin #10: [10 - 11] 5.0

Bin #11: [11 - 12] 1.0

Bin #12: [12 - 13] 0.0

Bin #13: [13 - 14] 0.0

Bin #14: [14 - 15] 0.0

Bin #15: [15 - 16] 0.0

Bin #16: [16 - 17] 0.0

Bin #17: [17 - 18] 0.0

Bin #18: [18 - 19] 0.0

Overflow: 0

Underflow: 0

Average: 3.298268613000755

Standard deviation: 2.5342635469921877

Kurtosis: 0.3312019436184787

Skewness: 1.0523915211663415


DONE!
You can use this information get a high-level idea of the properties
of this network, which may be useful to validate other research. For
example, a network with low average diameter and low clustering
coefficients in the clustering coefficient histogram is most likely a
small-world network (Watts, D. J. Strogatz, S. H. "Collective
Dynamics of Small-World Networks." Nature 393, 440-442,
1998, http://tam.cornell.edu/SS_nature_smallworld.pdf).
6. Known issues
Here are some of the known issues with this current release of the
product:
- Interactive Help: there is no interactive help currently
in the product. This document serves that purpose for the time being.
- Node Highlighting: when
you search for nodes, cliques, or hubs the highlighted nodes may be
laid out underneath other nodes, so they appear invisible on the
screen. As an interim solution, you can move nodes around to uncover
them.
- Repeated Cliques: the
same clique will be found more than once (in fact, it will be found and
highlighted once for every node in the clique; this is because every
node that participates in the clique meets the N and K requirements for
a clique).
- Self-looping Nodes: many
nodes in the network have self-loops. These are currently not displayed
due to a limitation in the graph drawing library.
- Default Attributes: the
XIN loader does not handle default attributes (http://dip.doe-mbi.ucla.edu/dip/Guide.cgi?SM=0:3)
- Memory Use: the networks
tend to be quite large, so if you open more than 2 or 3, the program
will probably run out of memory and silently crash. You can launch it
again and give it more heap space via command line parameters (http://java.sun.com/j2se/1.4.2/docs/tooldocs/windows/java.html#options).
By default, the program is launched with a maximum of 512MB of memory.


