Tom Goddard
September 25, 2016
This program simulates the motion and spin of a ping pong ball hit by a paddle. It can be used to see the paddle velocity and angle needed to produce spinny serves and to understand how to hit a spinning shot from your opponent. The ball flight and spin are shown graphically and speed and spin numbers are listed.
The program is currently only available for Mac. The latest version of this page is here.
| Operating System | Distribution | Date |
|---|---|---|
| Mac OS 10.11 | spindoctor-2018-03-23.dmg | 3/23/2018 |
The program is written in Python and C++ and uses Python 3, Numpy, PyQt5 and Qt 5.7 all included with the software. All of these are available on Windows and Linux but I have not compiled the program on those operating systems. Here is source code spindoctor-src-2016-09-25.zip
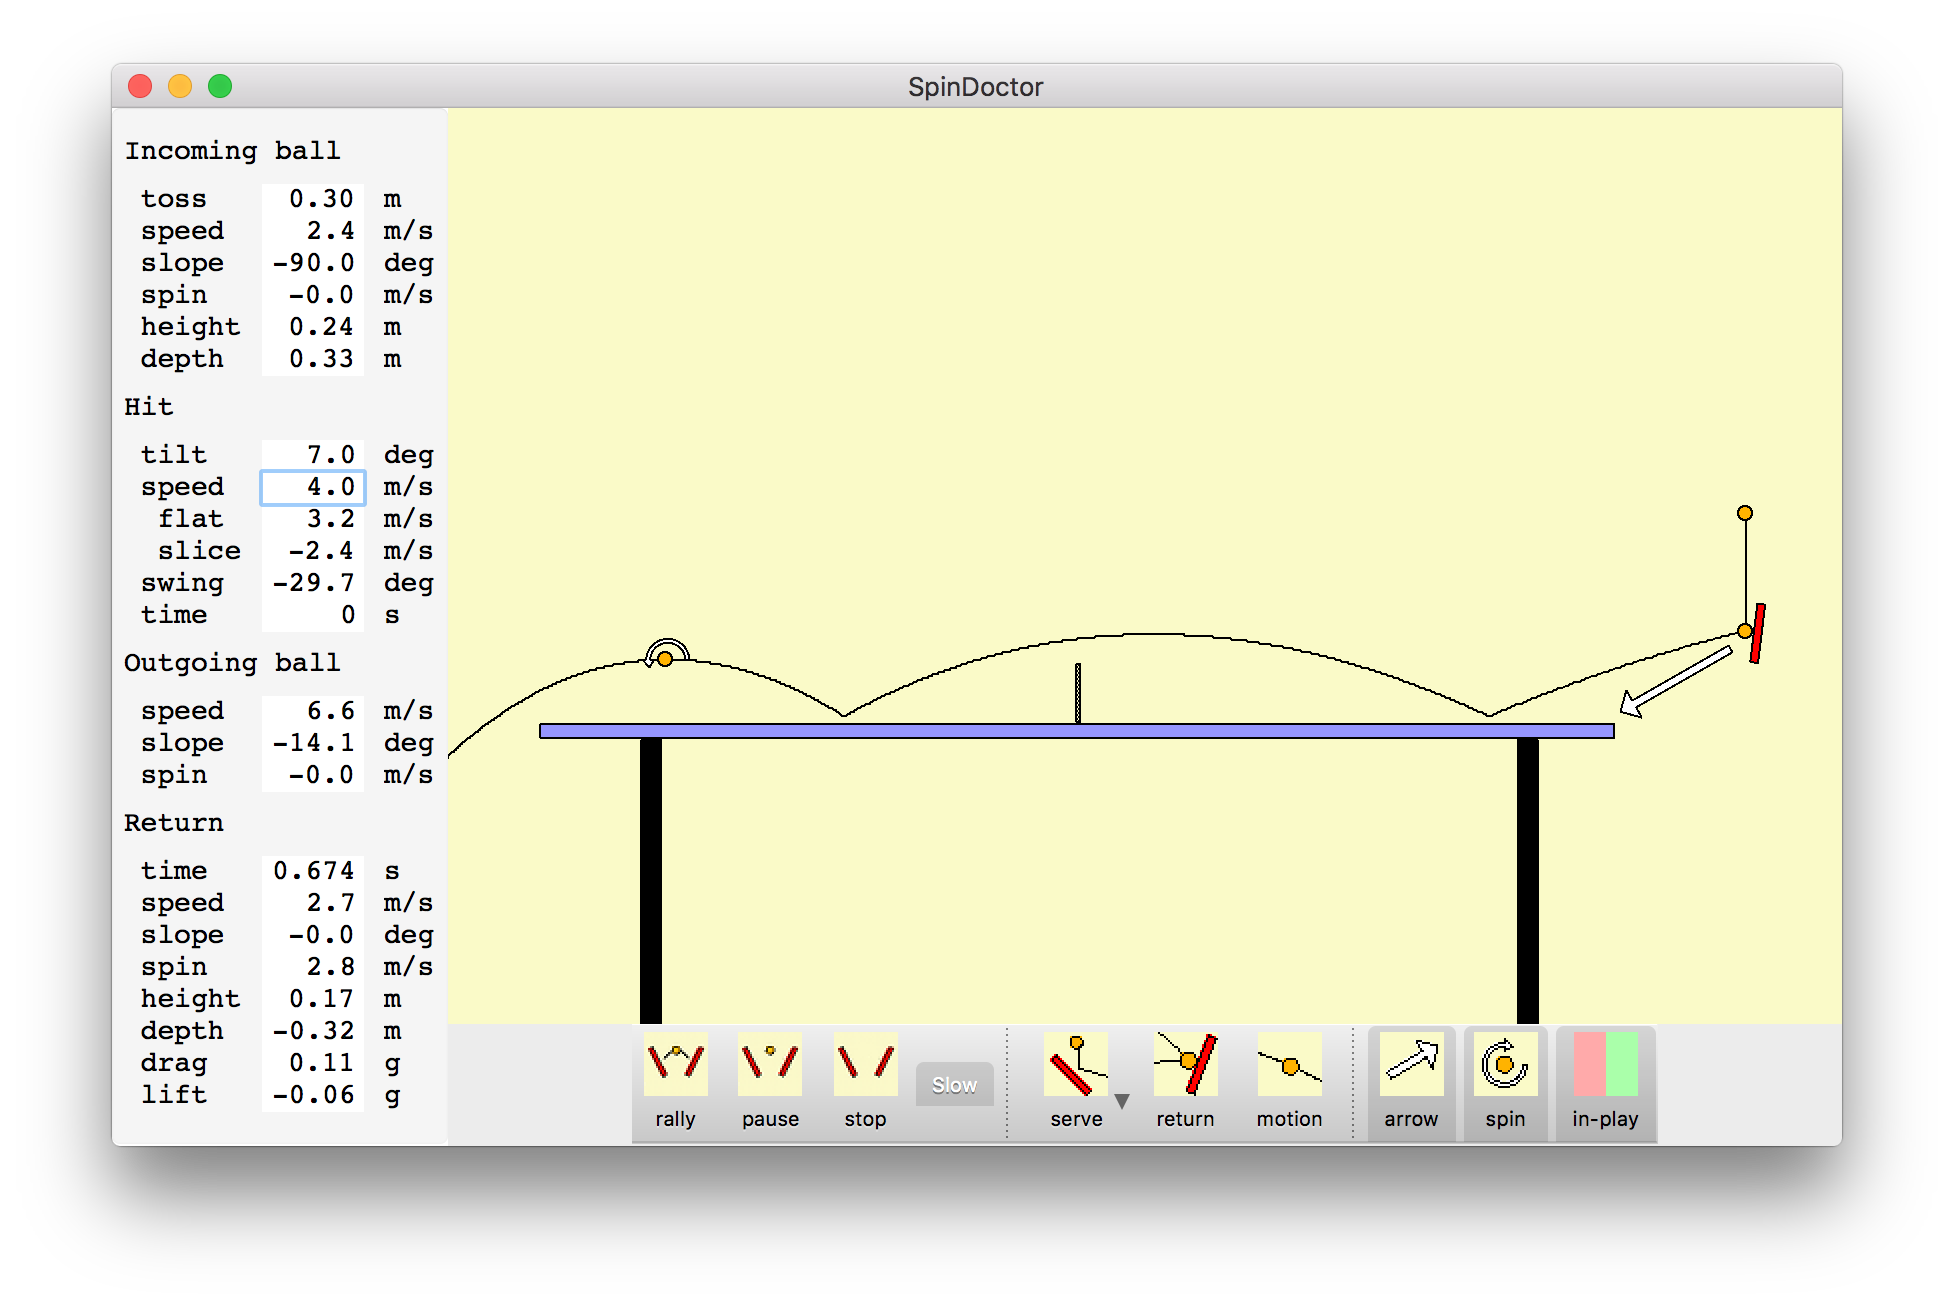
Change how the ball is struck and the trajectory and numeric parameters update immediately.
Paddle velocity. Drag the tip of the white arrow that extends from the paddle to change the paddle velocity. Dragging starting from most points on the yellow background (not under the table) also will change the strike velocity.
Paddle angle. Drag either edge of the paddle to rotate it to a new angle. The mouse scroll wheel (or two-finger drag on Mac trackpad) will also change the paddle angle.
Paddle position. Drag the center of the paddle to move the paddle position.
Pan and zoom. Click under the table and between the table legs and drag up and down to zoom or drag side to side to move the table horizontally.
Serve toss height. To change the height of the serve toss click the ball at the top of the toss and drag it up or down.
Return ball position. Numerical parameters are shown for a ball position along the trajectory called the Return position. By default the return position is at the top of the arc after the ball bounces on the opponent's table. (The menu entry Play / Receive Deep changes the default return position to after to the top of the bounce where the ball has dropped to the height of the table.) A ball with a circular arrow indicating spin is shown at that position. To see the numerical parameters for other positions click and drag the return ball.
Net clearance height. To adjust how high the ball passes over the net, click the ball trajectory curve above the net and drag up or down. This adjusts the paddle velocity and angle to achieve the new height while keeping the position of the bounce on the opponents table and the spin at the top of the bounce unchanged.
Ball bounce depth. To adjust where the ball bounces on the opponents table, click the ball trajectory at the bounce position and drag it left or right. This adjusts paddle velocity and angle to keep the height the ball passes over the net and the spin after the bounce unchanged.

![]() In play paddle velocities.
Click the in-play button to overlay on the graphics green and red regions
indicating where the tip of the paddle velocity vector puts the ball in play or out long.
In play paddle velocities.
Click the in-play button to overlay on the graphics green and red regions
indicating where the tip of the paddle velocity vector puts the ball in play or out long.
![]() Show ball motion.
To animate the ball motion click the motion button.
Show ball motion.
To animate the ball motion click the motion button.
![]() Slow motion.
The animation of motion can be slowed down to 5 times slower than real-time
by pressing the slow button.
Slow motion.
The animation of motion can be slowed down to 5 times slower than real-time
by pressing the slow button.
![]() Return the serve.
To switch from serving to returning the serve press the return button.
The paddle will move to the other side of the table for striking the ball at the
position or the return ball graphic.
Return the serve.
To switch from serving to returning the serve press the return button.
The paddle will move to the other side of the table for striking the ball at the
position or the return ball graphic.
![]() Serve.
To switch back to serving press the serve button.
Pressing the small triangle next to the serve icon will show a menu of
short and serves and choosing a menu entry will set initial paddle
velocity and angle.
Serve.
To switch back to serving press the serve button.
Pressing the small triangle next to the serve icon will show a menu of
short and serves and choosing a menu entry will set initial paddle
velocity and angle.
![]() Rally.
To animate hitting the ball back and forth press the rally button.
Random top spin and back spin shots will be made. The slow button
can be used to show slow motion, otherwise the speed is real-time.
Rally.
To animate hitting the ball back and forth press the rally button.
Random top spin and back spin shots will be made. The slow button
can be used to show slow motion, otherwise the speed is real-time.
![]() Pause rally.
To pause an animated rally press the pause button. Pressing rally
will restart the animation from where it was paused.
Pause rally.
To pause an animated rally press the pause button. Pressing rally
will restart the animation from where it was paused.
![]() Stop rally.
To stop automatic hitting the ball back press the stop button.
Stop rally.
To stop automatic hitting the ball back press the stop button.
![]() Hide spin indicator.
To hide the circular arrow around the ball that indicates spin, click the spin button.
The length of the circular arrow indicates the magnitude of the spin with one full revolution
corresponding to 5 m/s spin.
Hide spin indicator.
To hide the circular arrow around the ball that indicates spin, click the spin button.
The length of the circular arrow indicates the magnitude of the spin with one full revolution
corresponding to 5 m/s spin.
![]() Hide velocity arrow.
To hide the paddle velocity arrow, click the arrow button.
Hide velocity arrow.
To hide the paddle velocity arrow, click the arrow button.
The ball trajectory and spin parameters are shown in the left column of the window using menu entry View / Show Parameters. The parameter values can be changed by clicking on any value and typing a new value and pressing the enter key. The speeds, spins, positions, ... are in metric units, meters and seconds and angles are in degrees.
The flight parameters are in 4 sections Incoming ball, Hit, Outgoing ball, and Return.
Incoming ball parameters. Incoming ball parameters describe the velocity, spin and position of the ball just before it is hit.
Hit parameters. Hit parameters describe the paddle angle and velocity.
Outgoing ball parameters. Outgoing ball parameters describe the ball speed and spin immediately after it is hit.
Return parameters. Return parameters describe the ball speed and spin some time after the hit at the position indicated by the ball graphic on the trajectory -- typically where the return hit will be made. That position can be moved by dragging the ball position along the trajectory curve to see the changing speed and spin caused by bouncing and drag forces.
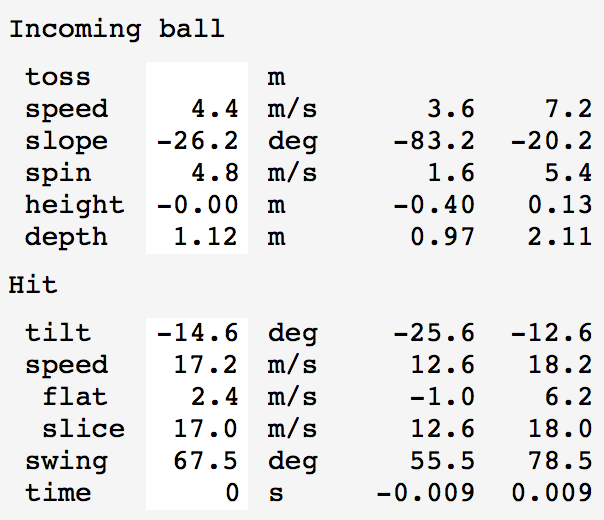
How much error in reading the incoming ball spin and speed will permit the same paddle stroke to put the ball in play? How much variation in the paddle hit swing, speed and blade angle can be made keeping the ball. This is indicated using menu entry View / Show Parameter Ranges. It adds two extra columns to the parameter panel on the left hand side of the window. For each incoming ball and paddle hit parameter the range of values that keep the ball in play given the current values of the other parameters is given. The time range assumes the paddle width is 15 cm and indicates the timing variation of the swing that would cause the paddle to miss the ball.
Here are a couple applications of how the program can help understand common problems in table tennis.
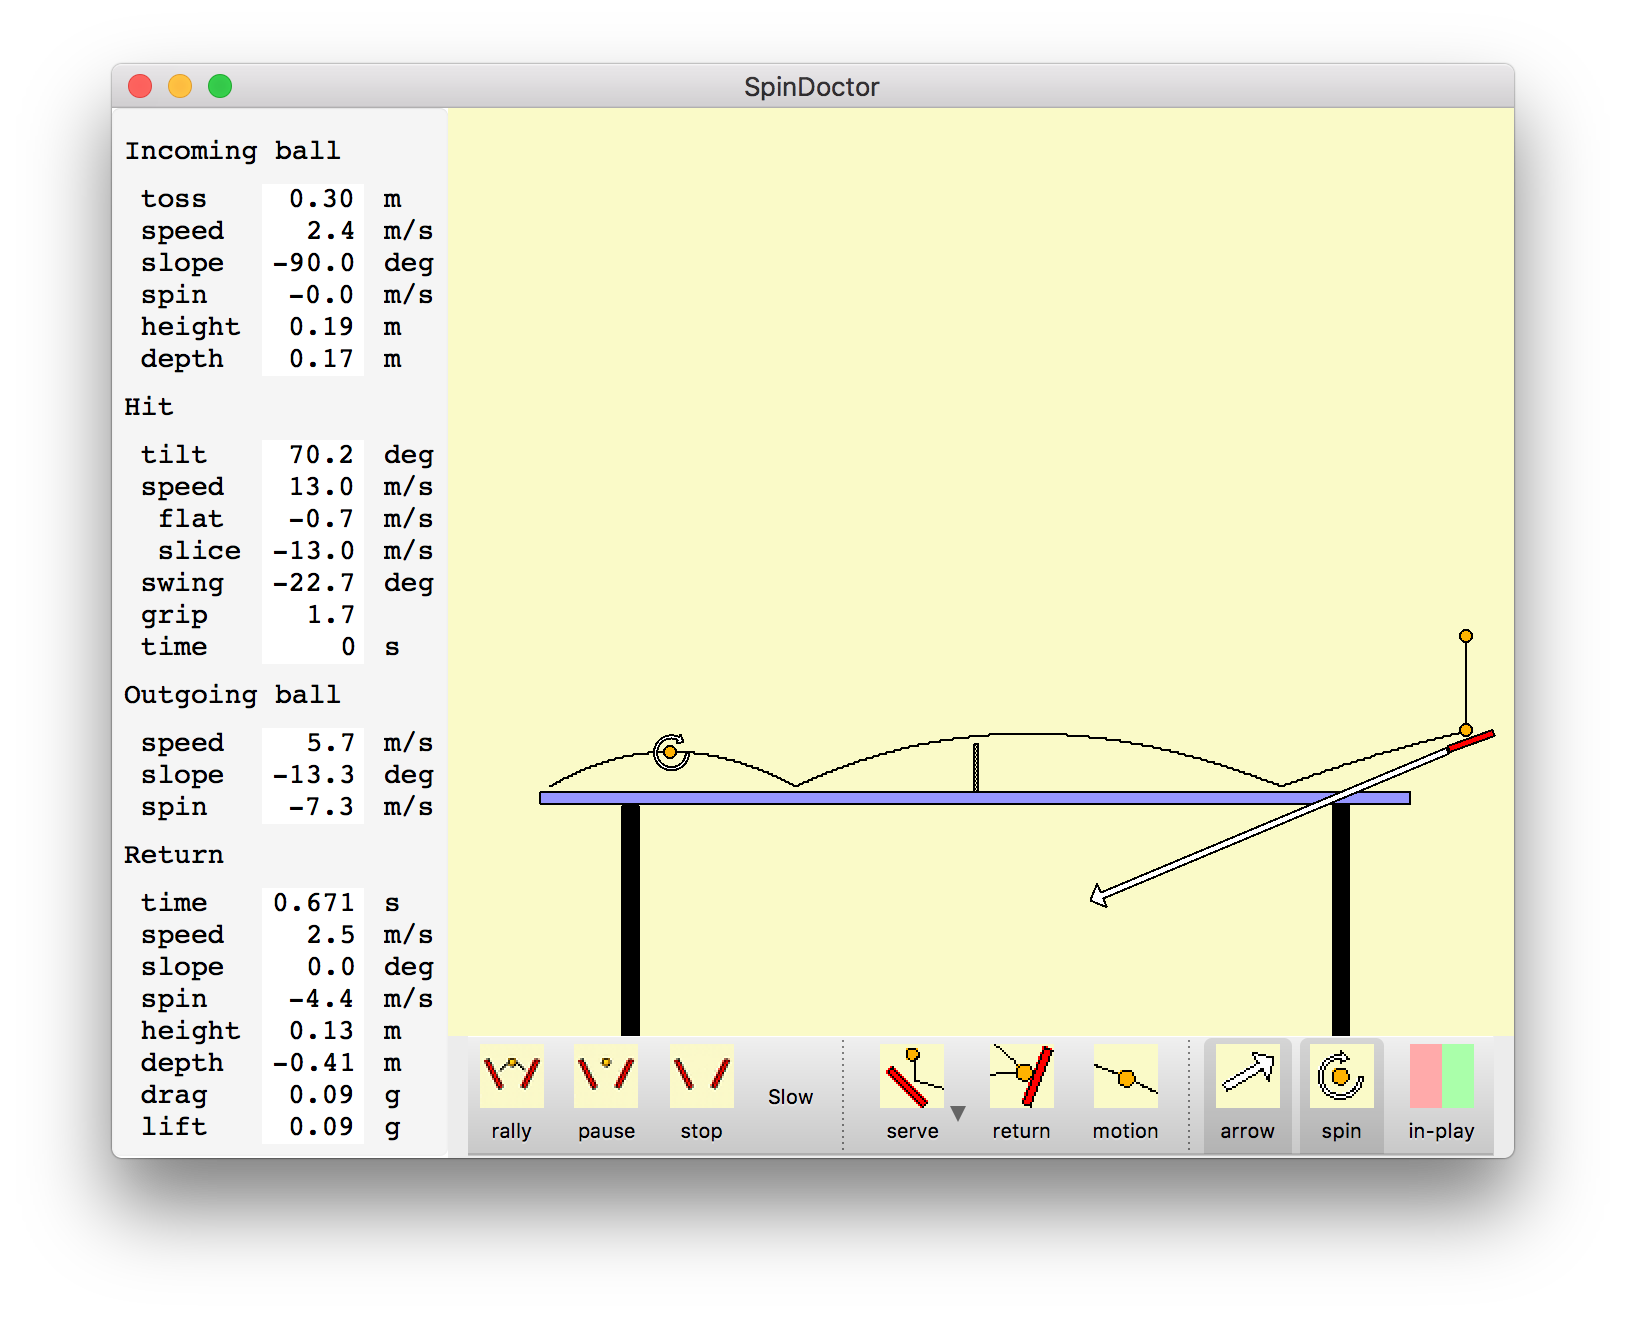
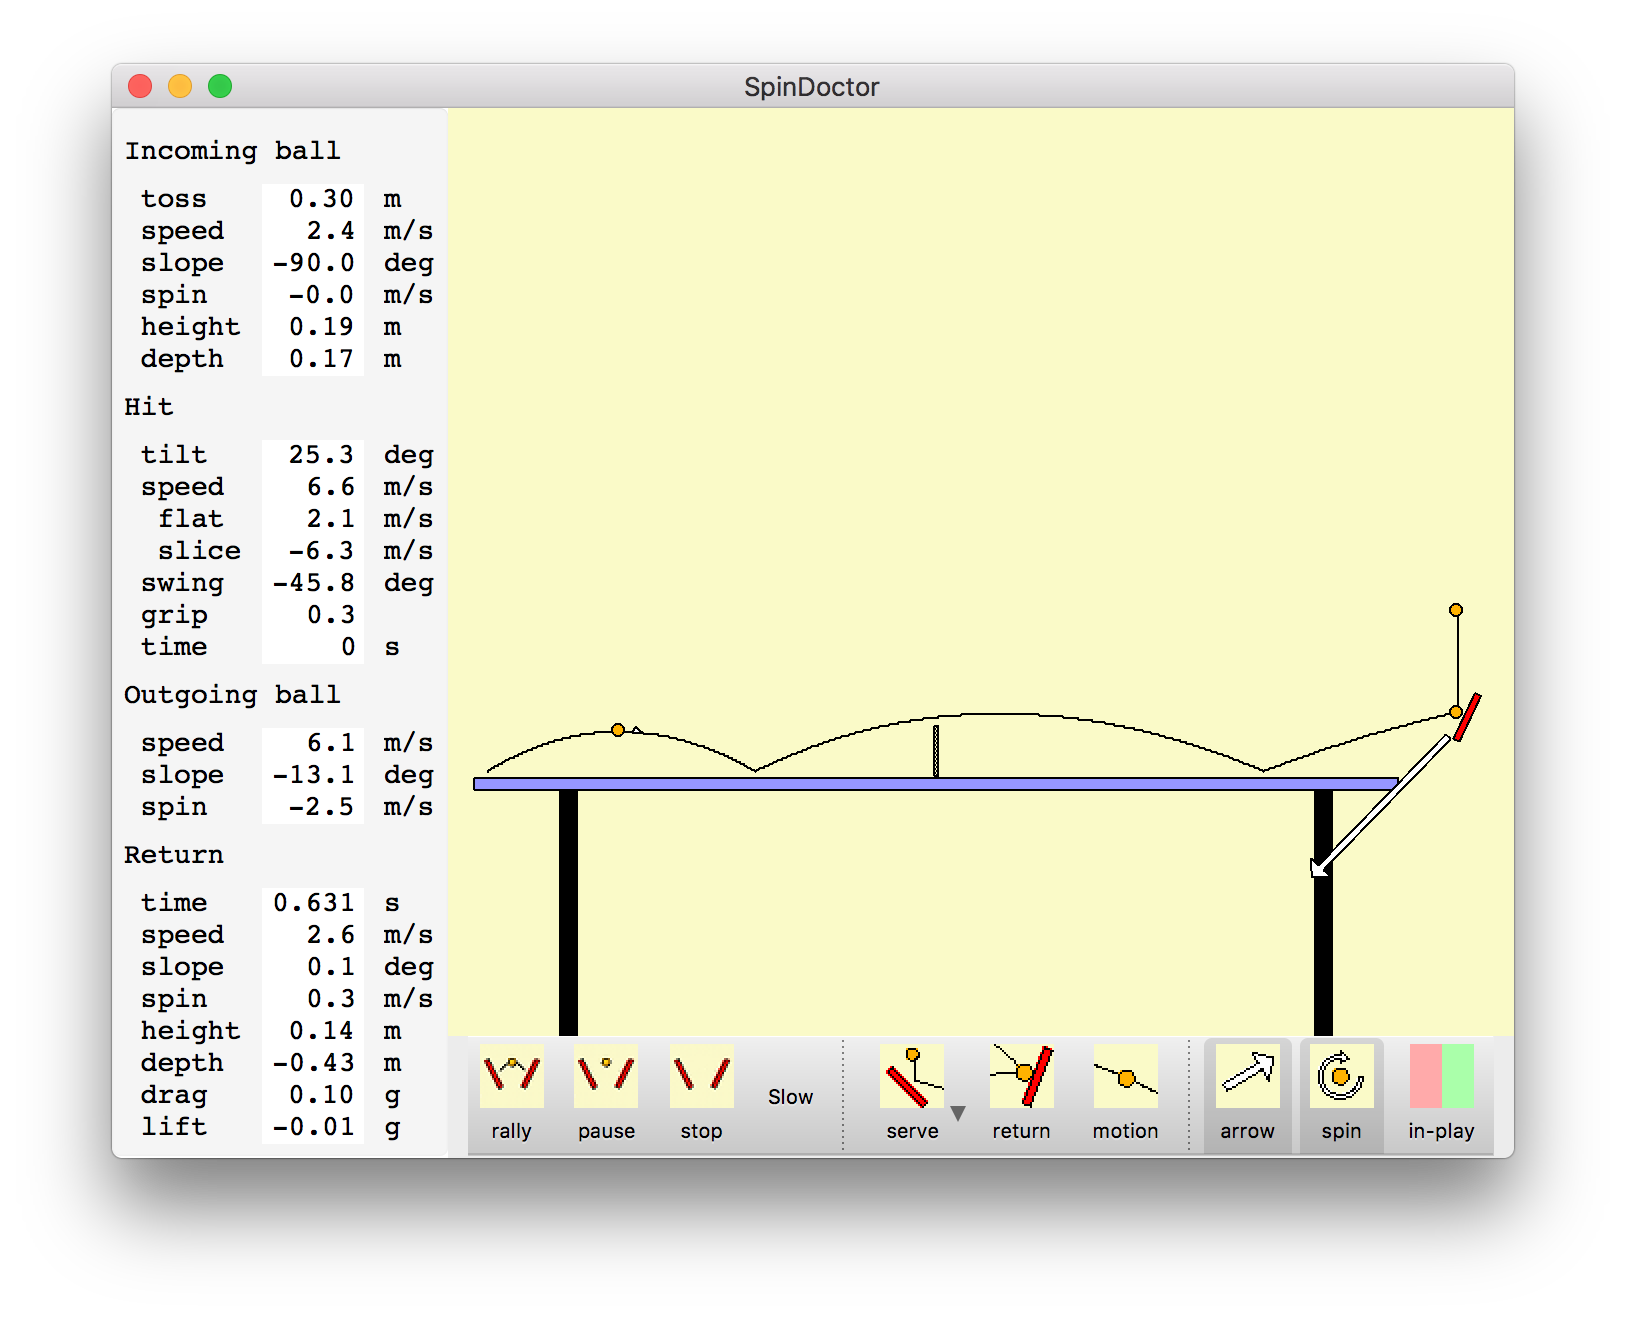
Can similar looking paddle motions produce a short heavy backspin serve and a short no-spin serve? Consider serves that barely clear the net and bounce twice on the receiver's side of the table with the second bounce at the end of the table. We can also ask that the ball have a specified spin at the top of the bounce after striking the opponent's side of the table. Specifying minimum net clearance, second bounce at the end-line and a desired spin gives 3 constraints. The serving paddle velocity (horizontal and vertical) and paddle angle are 3 parameters we can adjust to meet the 3 constraints. In general there will be only one set of serve velocity and paddle angle that achieve the desired flight. We are ignoring 3 other degrees of freedom in making the serve, the toss height, height above and distance behind the table where the ball ball is struck. To make two serves look the same we will keep those serving parameters fixed. The images show the program simulating a short heavy backspin and short no-spin serves.
| 
|
| Backspin short serve | No spin short serve |
|
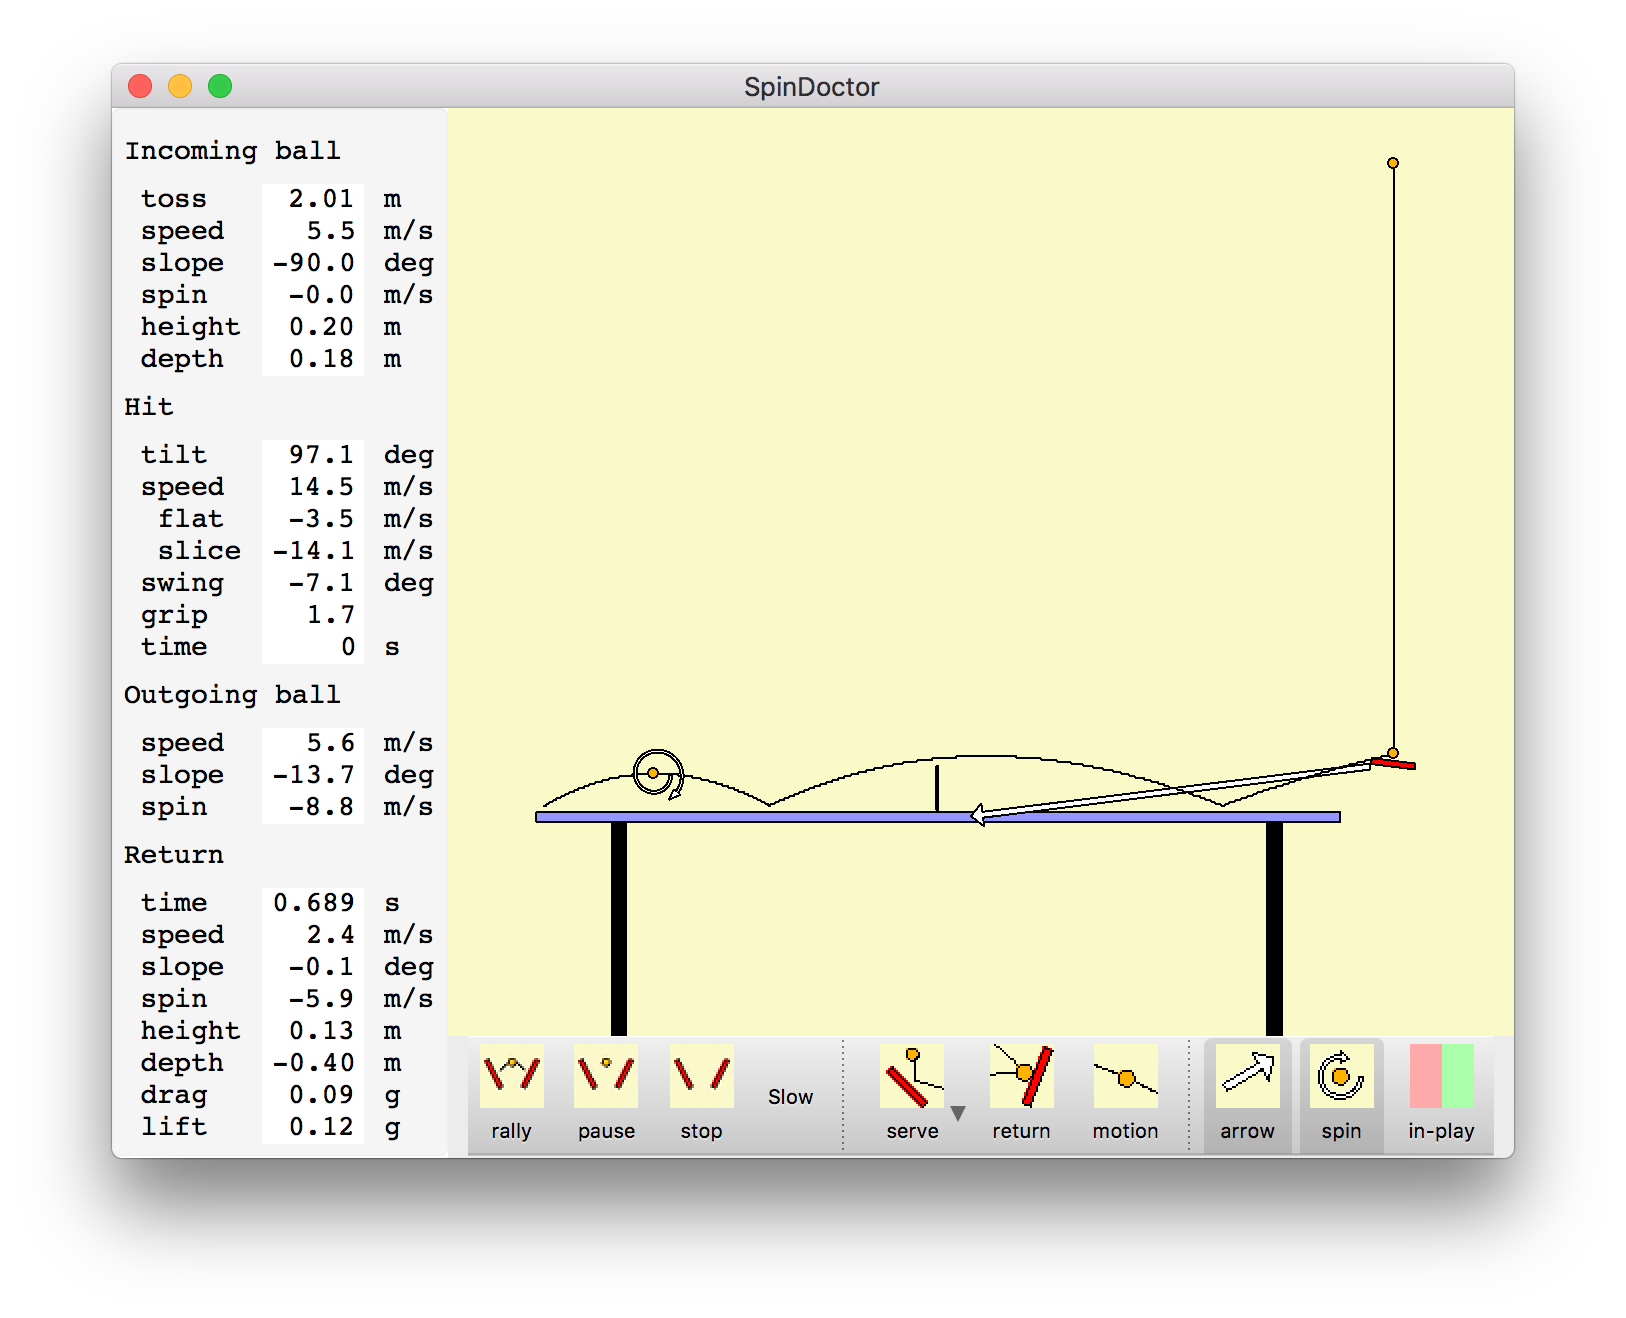
| High toss heavy backspin short serve |
The backspin serve has paddle angle at 70 degrees from vertical while the no spin serve has paddle at 25 degrees from vertical. The most easily perceived difference between the two serves is probably that the paddle speed is twice as high for the backspin serve. The backspin paddle speed is 13 meters/second while the no spin serve paddle speed is half of that at 6.6 meters/second. This is the speed of the contact point of the paddle with the ball. The two speeds can be made to look the same by striking the backspin serve at the tip of the paddle, and the no spin serve near the handle of the paddle. With paddle rotation about the wrist the speed near the paddle tip can be about twice the speed near the handle. Differences in paddle angle and swing direction could be disguised by finishing the serve after striking the ball with a common motion. The swing direction is about 23 degrees down from horizontal for the backspin serve and 46 degrees down for the no spin serve.
Players claim that a high toss serve can produce more backspin than a low toss serve. Simulating a 2 meter high toss above the contact point with paddle shows that a backspin of about -6 meters/second can be achieved while a lower toss of 0.30 meters produces a backspin of -4.5 meters/second (surface rotation speed of ball). To achieve the heavier backspin also requires an extreme paddle angle, 97 degrees from vertical in this example, or hitting slightly in front of the bottom of the ball (front edge of paddle 7 degrees above back edge).
To get the maximum speed loop, giving the shortest time between when the ball is hit and when it lands deep on the opponent's table, the largest downward force on the ball caused by its spin is needed. The downward Magnus effect force is proportional to the product of the spin rate and the linear speed of the ball. So both the spin and speed need to be high. A ball that has very high spin, but relatively slow speed will not experience a large downward force.
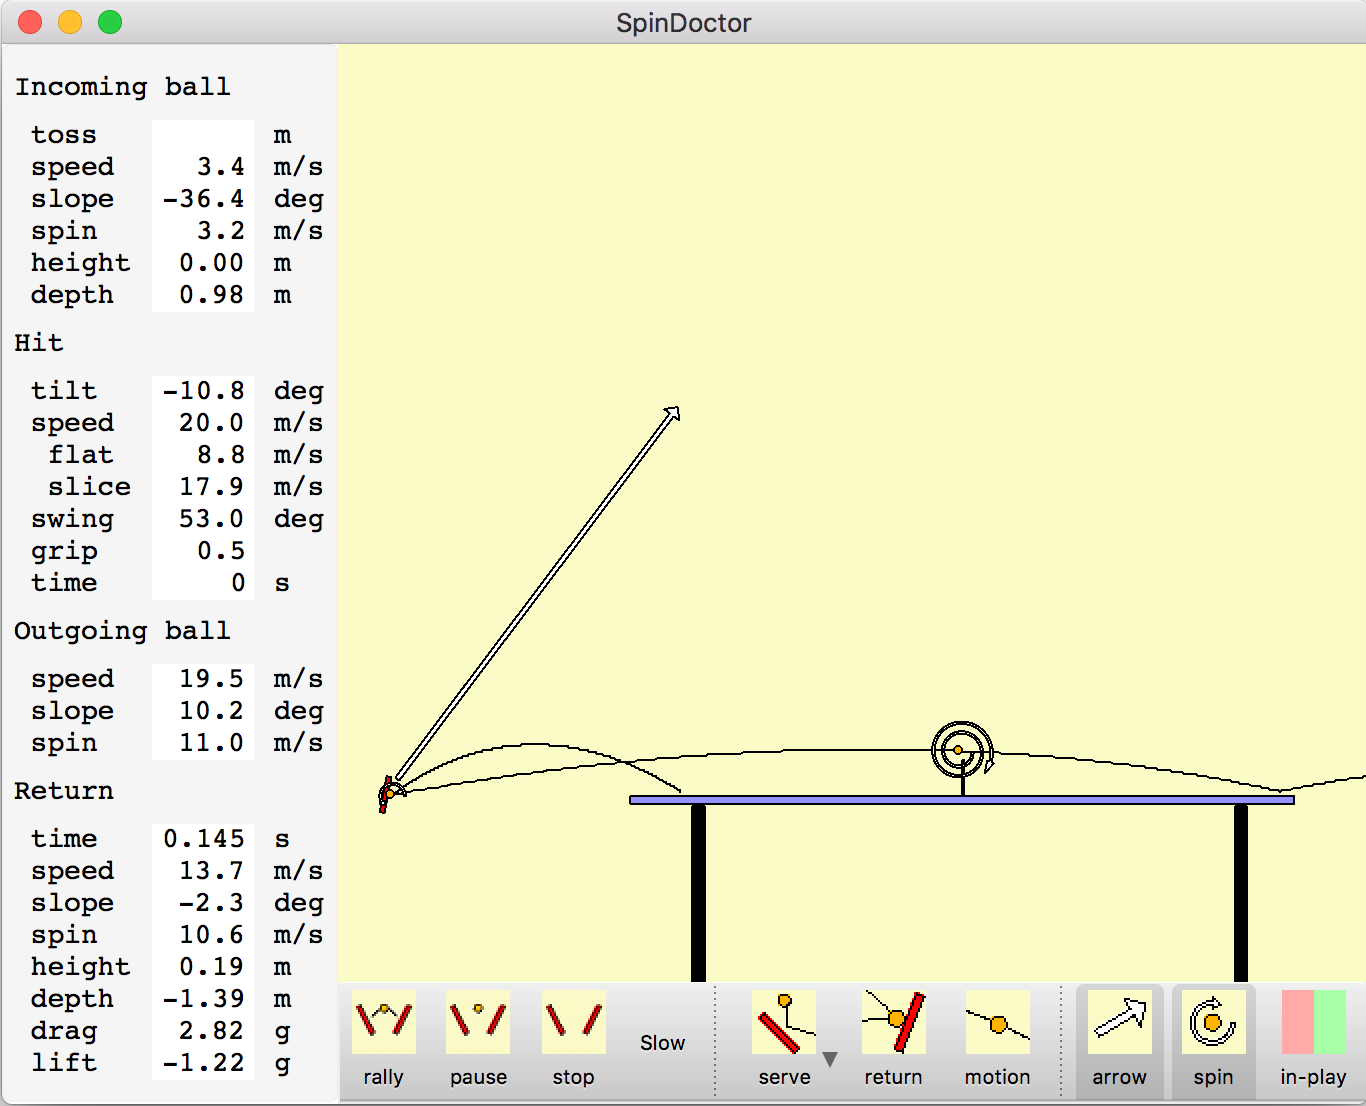
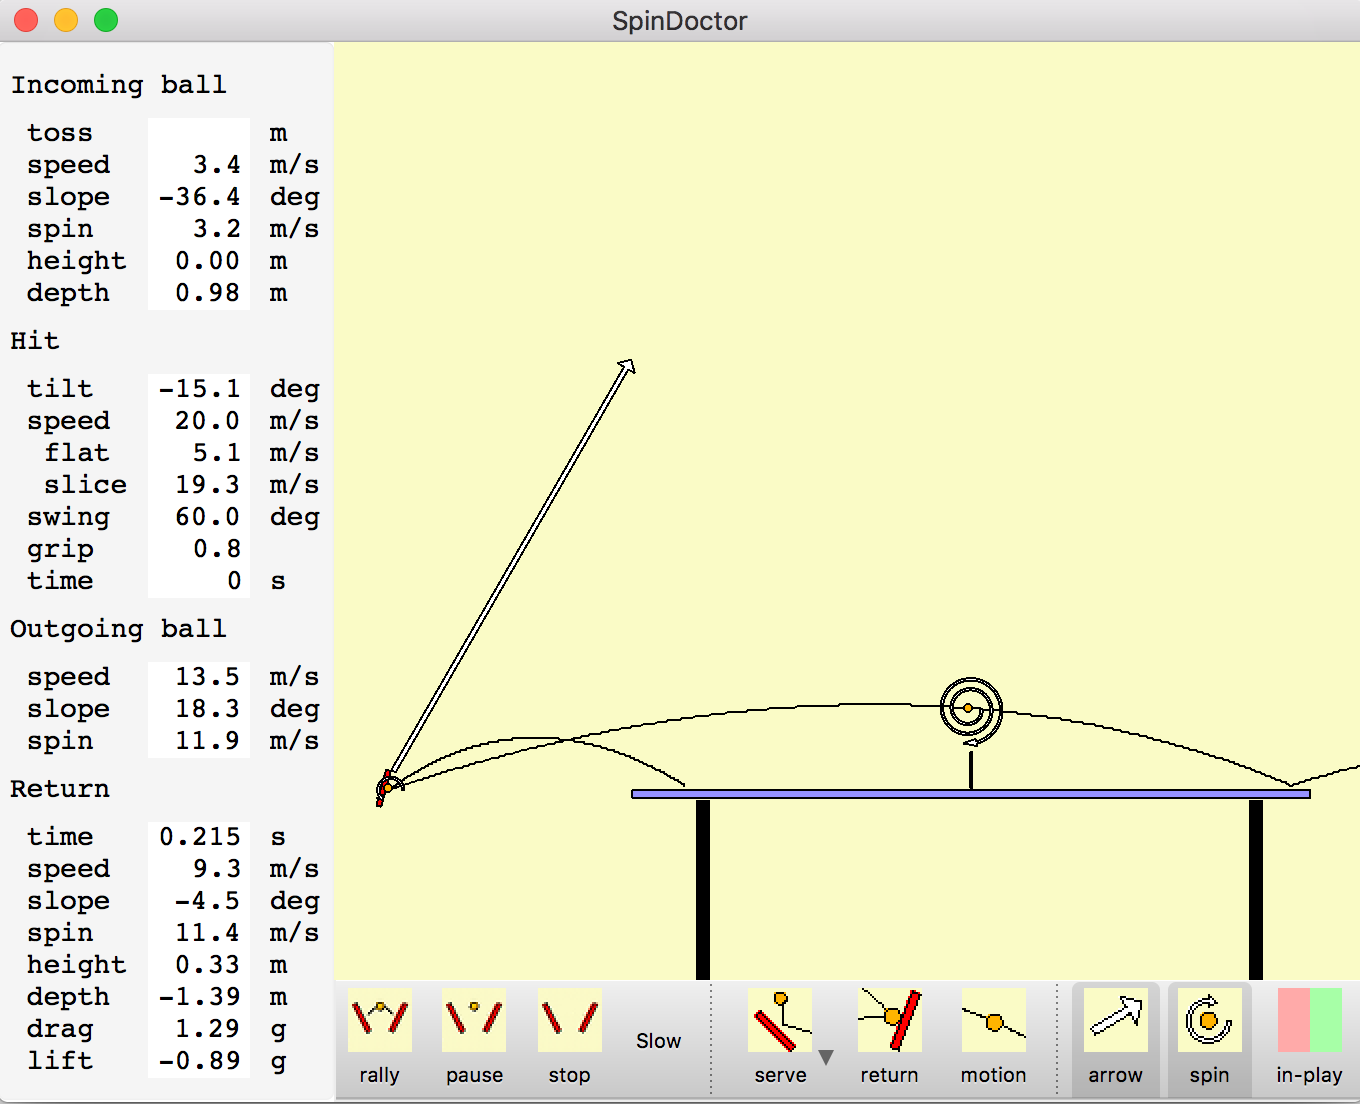
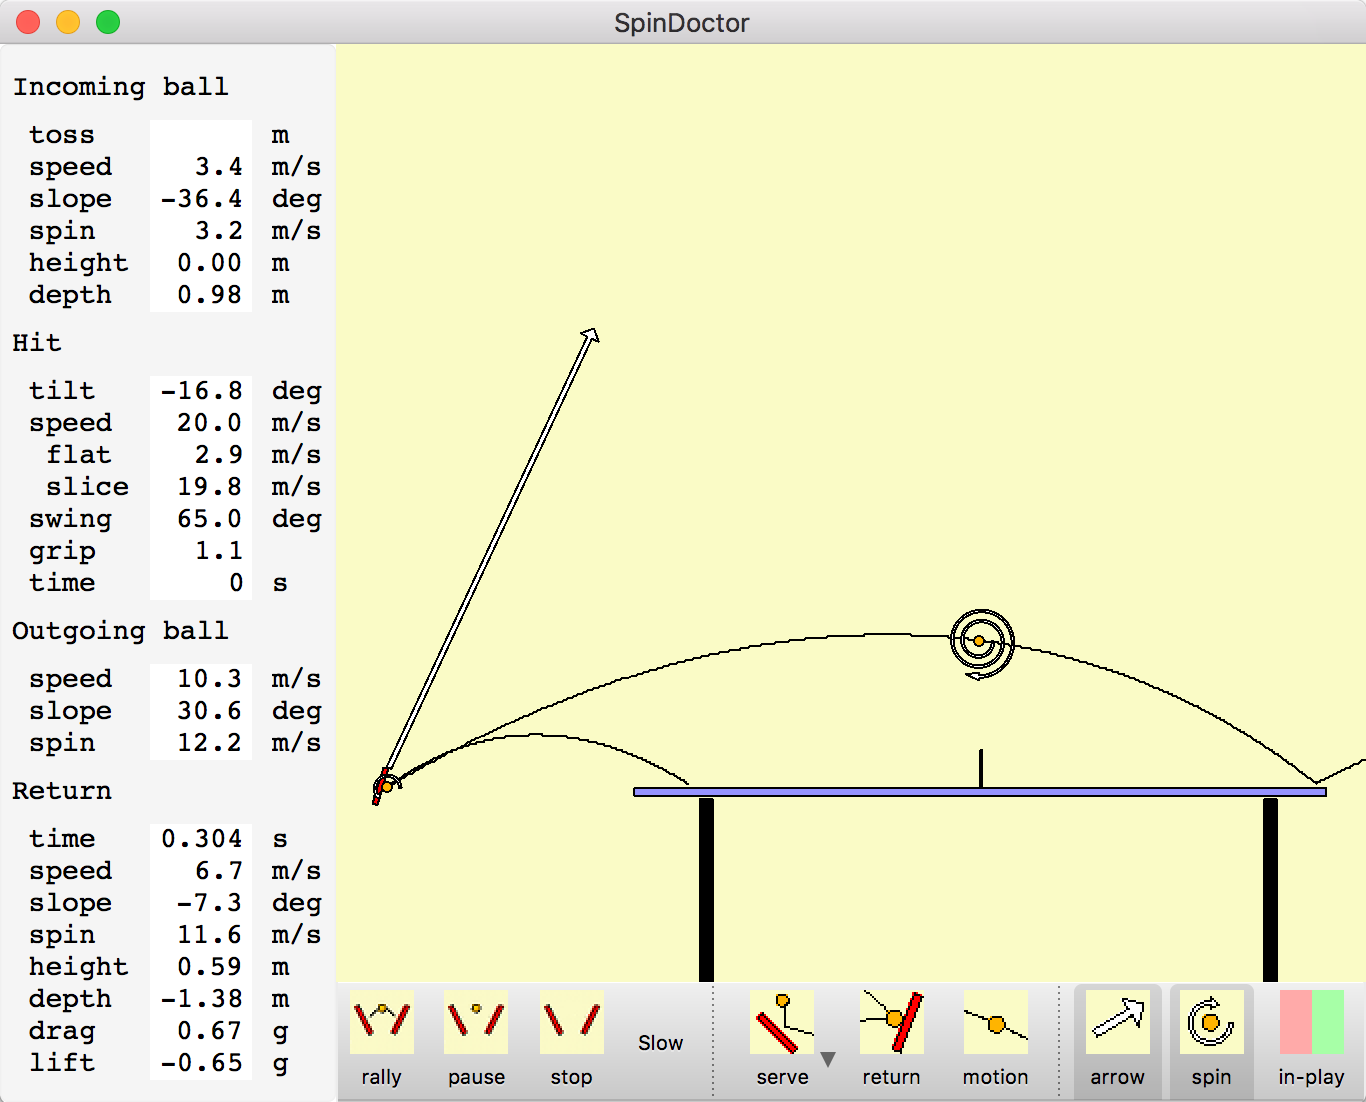
To see how strong this effect is consider striking the ball with a 20 meter/second paddle motion. Strike the descending ball at table height about 1 meter behind the table. Consider different swing directions and adjust paddle angle to land the ball at the back edge of the opponent's table. Properties of the different loop shots are shown in the table.
| Swing angle (degrees from horizontal) | Spin off paddle (m/s) | Ball speed off paddle (m/s) | Ball speed at net (m/s) | Ball speed at bounce (m/s) | Height at net (m) | Magnus force at net (g) | Time to bounce (sec) |
|---|---|---|---|---|---|---|---|
| 53 | 11.0 | 19.5 | 13.7 | 11.4 | 0.19 | -1.22 | 0.251 |
| 60 | 11.9 | 13.5 | 9.3 | 7.9 | 0.33 | -0.89 | 0.372 |
| 65 | 12.2 | 10.3 | 6.7 | 6.2 | 0.59 | -0.65 | 0.536 |
| 
| 
|
The more forward loop stroke that just clears the net hits the end line twice as fast in only 1/4 second versus 1/2 second for the high arc loop. The downward Magnus force on the ball of 1.22g versus 0.65g is almost twice as high. The spin is only slightly less for the more forward stoke. Of course the very low net clearance means it is easy to hit the net executing this loop kill shot.
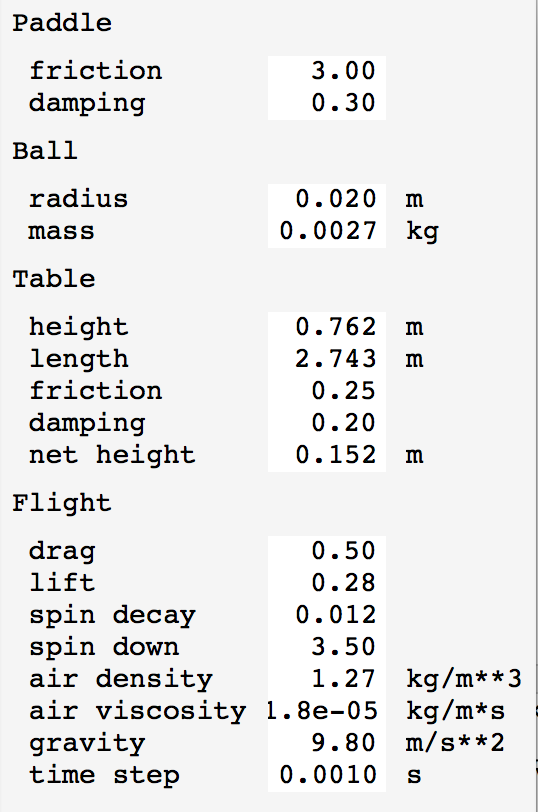
A simple physics model for this simulation is used. The parameters used in the physics model can be shown with menu entry View / Show Constants. There are friction and energy loss parameters for ball contacts with paddle and table that determine velocity change and spin change during a bounce. The ball will skid on the surface if the friction force is exceeded. Aerodynamic drag and the ball and Magnus effect lift from ball spin are used to compute the flight trajectory.
Bounce kinematics. When the ball bounces on the paddle or table the incoming speed, angle relative to the surface, and spin determine the outgoing speed, angle and spin. To simplify the case when the moving paddle strikes the ball we compute in the rest frame of the paddle. So our calculations are done for a ball bouncing off a stationary surface. We do an initial calculation assuming the friction force is large enough so that the ball does not slide along the surface at its point of contact. We compute the horizontal momentum transfer to the ball at the point of contact to achieve this non-sliding condition using the incoming speed, angle and spin and the moment of inertia of the ball taken as a thin spherical shell. To model the inelastic deformation of the paddle, table and ball which causes energy loss we reverse the component of ball velocity perpendicular to the surface and then reduce the vertical speed using an energy damping factor that is based just on the vertical speed kinetic energy. This is achieved with an instantaneous momentum transfer perpendicular to the surface. Next we see if the no sliding assumption holds given the friction coefficient. The friction coefficient is the ratio of maximum sliding force (parallel to surface) to perpendicular force. In our instantaneous momentum transfer model take the no slide condition as the parallel momentum transfer is less than or equal to the friction coefficient times the perpendicular momentum transfer. If this conditions is met we compute the post-bounce spin and velocity based on the momentum transfer. The parallel component acts at the contact point and changes the angular momentum. If the friction is exceeded we assume the ball to slip in place and we reduce the parallel to surface momentum transfer to the maximum allowed by the friction coefficient. After computing the post bounce velocity and spin we convert back to the reference frame of the table.
Grazed ball motion. If a force is applied to a stationary ball surface that is parallel to the surface the ball will move in the direction of the force and begin to spin. An approximation to this force can be applied by grazing the ball with a paddle. If the ball does not slip on the paddle and the paddle speed parallel to the ball surface is v, then the ball center moves at speed 0.4*v and the ball spins such that the speed at its surface is 0.6*v. The sum of the center and spin speeds exactly matches the paddle speed. The division of 40% center of motion speed and 60% spin surface speed is dictated by the moment of inertia of the ball which is a thin spherical shell (I = 2/3*m*R*R). This idealized grazing hit can't be achieved in practice because the ball has to press against the paddle in order to not slip.
Bounce equations# Bounce off y = 0 plane from above. # # vx, vy = initial ball velocity (vy < 0) # w = initial rotation rate (radians / sec) # r = ball radius # e = fractional kinetic energy loss in bounce perpendicular to surface. # mu = coeficient of sliding friction. # ux, uy = final ball velocity # wout = final rotational rate # # Equations are for ball moment of inertia I = 2/3*m*R*R. # f = sqrt(1 - e) uy = -f*vy vcx = vx + w*r # tangential contact speed vslip = 2.5*mu*(1+f)*abs(vy) # slip speed if abs(vcx) <= vsx: # Within friction limit, sticky contact. ux = vx - 0.4*vcx wout = w - 0.6*vcx/r else: # Exceeds friction limit, skidding contact. sign_vcx = (-1 if vcx < 0 else 1) dvcx = vslip * sign_vcx ux = vx - 0.4*dvcx wout = w - 0.6*dvcx/r
Aerodynamic drag. The aerodynamic drag on the ball is taken from stardard fluid mechanics flow around a smooth sphere with drag force proportional to speed squared. The Reynold's number measuring the relative importance of inertial and viscosity effects is in the range of 1e4 to 1e5 for a ping pong ball in air and over this range the drag coefficient is very nearly constant. The drag force is opposite the direction of motion. In our model spin has no effect on drag.
Drag equations# r = ball radius # d = density of air (1.27 kg/m**3) # c = drag coefficient (0.5) # f = drag force A = pi*r*r # Ball frontal area. v2 = vx**2 + vy**2 # Ball speed squared f = (1/2) * d * v2 * c * A
The drag dependence on speed squared has the interesting consequence that for a ping pong ball in straight line motion it will decrease its speed by half each 5 meters travelled independent of the initial speed.
# k = 0.1478 (1/meter)
dv/dt = -k*v**2
v = v0 * exp(-kx)
v/v0 = 0.5 => kx = log(2), x = 4.69 meters = 15 feet.
Also the terminal velocity of a ping pong ball falling in gravity is according to this drag model is 8 m/sec.
# g = 9.8 m/s**2  acceleration of gravity
m*k*v**2 = m*g
v = 8.14 m/s
Aerodynamic lift. The spin of the moving ball creates differential air flow around the two sides of the spinning ball (sides meaning perpendicular to motion and spin axis) caused by viscosity of air entrained by the ball. This is called the Magnus effect and produces a lift force on a backspin ball and downward force on a topspin ball. The top spin effectively increases the force of gravity allowing hitting a faster shot and still having it come down on the table. Magnus forces equal to the force of gravity are achievable with heavy spin and fast ball speed causing a back spin ball to rise above a straight line trajectory, or a top spin ball to be pulled down by twice the force of gravity. The Magnus force is proportional to the product of ball speed and ball spin. Faster paddle speed increases both the speed and spin so the lift increases quadratically with the paddle speed.
Lift equations# vx,vy = ball velocity # w = angular speed (radian/sec) # r = ball radius # d = air density (1.27 kg/m**3) # cl = lift coefficient (0.28) v = sqrt(vx*2 + vy*2) A = pi*r*r f = cl * 0.5 * d * A * w*r * v
Spin decay. The viscosity of air also slows the spin rate of the ball. This is a small effect. There is a term in the decay rate of angular velocity w proportional w*v described as the Tavares model in The Effect of Spin-Down on the Flight of a Baseball by Alan M Nathan. Another term accounts for the spin decay when the ball has linear speed 0 and is proportional to w**1.5. I haven't been able to find the literature reference I used for this term. A few articles discuss stationary spin decay with w**2 or w dependence.
Spin decay equations# vx,vy = ball velocity # w = angular speed (radian/sec) # r = ball radius (0.02 m) # m = ball mass (0.0027 kg) # d = air density (1.27 kg/m**3) # q = viscosity of air (1.8e-5 kg/(m*s)) # c0 = spin decay coefficient (3.5) # cv = spin drag coefficient (0.012) A = pi*r*r v = sqrt(vx*2 + vy*2) dw/dt = -c0*sqrt(q*d)*r*r*1.5*w*sqrt(|w|)/m - cv*1.5*d*A*v*w/m
If we consider just the speed dependent w*v decay term at constant ball speed v = 10 m/s the spin decay takes about 6.5 seconds for the spin rate to drop to half its initial value. Over a 1 second duration (typical time from hit to opponent's hit) the spin decay is just 10%. So the spin reduction is small.
Simplistic paddle bounce model. The bounce response of actual paddle rubber and blade is surely more complicated than our friction plus damping model. There are likely significant non-linear effects where the speed of impact effects energy loss.
No paddle acceleration. The paddle is taken to be moving a uniform velocity, i.e. no acceleration, and is not rotating when striking the ball. In actual play acceleration during the hit is common. But the change of velocity and rotation for the few milliseconds when the ball is in contact with the paddle surface is probably a very small effect given the range of achievable accelerations and paddle angular rotations.
Magnus effect lift. The Magnus effect lift coefficient 0.28 I believe is reasonable based on measurements of ball deflections with heavy side spin measured from a ping pong robot. There is extensive literature documenting the "reverse Magnus effect" where the sign of the force will be opposite the expected direction (e.g. "Inverse Magnus Effect on a Rotating Sphere: When and Why", Jooha Kim, et al, 2014 and "The aerodynamics of the beautiful game", J.W.M. Bush, 2013). This typically happens at Reynolds numbers higher than those for a ping pong ball, around 1e5 while values for ping pong of 2e4 are more typical. But it also depends critically on smoothness of the ball. The weird reversing behavior apparently happens when air flow on one side of the ball is laminar and the other side is turbulent. I did not find a source that experimentally measured the forces at the lower Reynolds numbers of ping pong, but the trend suggests that a constant lift coefficient may be reasonable.
Two-dimensional versus 3-dimensional simulation. I made the simulation 2-dimensional instead of 3-dimesional because the graphics and user interface is much simpler. This means hits that include side-spin cannot be simulated. All of the physics equations would work directly in 3 dimensions. A 3-d user interface would include specifying paddle angle side-to-side, swing angle side-to-side, spin axis of the ball, introducing many more parameters that would need to be controllable from the user interface. I think the resulting program would be much less useful because it would be more difficult to use.
No model of bio-mechanics. The physics of paddle, ball, and table are less important in playing table tennis well than the mechanics of moving the player's body (foot work, body rotation, weight transfer, stroke setup and follow through, ...). Simulating a person's motion to move and swing the paddle would probably be more insightful (but harder to implement) than simulating paddle, ball and table.
Friction coefficients. I measured the friction between ball and table and ball and paddle rubber by cutting 3 ball-size holes in cardboard that provide a tight fit for 3 balls. This holder can then be set on the table surface with only the 3 balls contacting the table. Then lifting the table until the balls and holder just begins to slide gives the friction coefficient as the slope of the table. This works well for the table. I used the same technique for the friction of balls against paddle rubber. This is harder to measure because the friction is very high requiring a very steep slope before slipping occurs with high quality rubbers such as Butterfly Tenergy 05.
Bounce energy loss. The ball loses energy when bouncing off the paddle or table. I measured this by taking an audio recording of a ball bouncing on the table. I dropped the ball vertically from about 30 centimeters onto the table and recorded the sound of 10-20 bounces. I used a simple program to extract the times of the click sounds from the ball striking the table and using the time between clicks inferred the bounce height which is proportional to the energy of the ball. Plotting showed nearly identical fractional energy loss on each bounce. Deviations occured for drops from higher distances most probably due to aerodynamic drag on the ball. Energy loss dropping the ball on a fixed paddle also showed a constant fraction energy loss. These energy loss fractions were derived at slow ball speeds since higher drops show aerodynamic drag effects. It is very likely that energy loss will be higher fractions of incident kinetic energy at higher speeds due to non-linear effects.
Paddle swing peak speeds. I think typical peak paddle speeds for club players are around 20 meters/second. This could be measured with careful video analysis, easier with short video camera exposure times (< 1/500 second) and marked spots on a paddle. Higher video frame rates would also be helpful. I tried this with typical consumer video camera (circa 2011) which could not produce the short exposure time with available lighting so image frames had large motion blur on the paddle and large paddle motion between frames. At 20 m/s and 30 frames/sec video, get 66 cm of travel between frames. Acceleration will significantly change speed over that distance. I don't recall what the results were (documenting this 5 years later).
One way to get an estimate of speeds is to consider how far a thrown object would fly (neglecting aerodynamic effects) if released at a given speed at a 45 degree upward angle.
d = v*v/g where g = 10 m/s**2
I think a reasonable distance for a typial loop paddle stroke if the paddle was released would be about 40 meters if aerodynamic effects could be neglected (e.g. throwing a compact object such as a stone of similar weight to a paddle from the same motion). This would correspond to a release speed of 20 meters/sec. Wrist snap might produce somewhat higher speed. The fastest baseball pitch speed is about 100 miles per hour or 45 meters/second, significantly faster, but the throwing motion is optimized for speed. A baseball weights 145g close to typical paddle weights of 190g. I would guess a professional table tennis player might reach 30 m/s racket speed on a loop stroke, but slower speeds when the paddle is more face-on (smash) and aerodynamic drag is likely to reduce the peak attainable speed.
January 2011. Wrote initial simulation and user interface code. Python 2, PySide, Qt 4.
September 2016. Updated to Python 3.5, PyQt5 and Qt 5.7, packaged as a Mac application, and wrote documentation.